2D Wing Optimization, Endplates, and Nose Cone
Preliminary 2D Multi-Element Optimization
After selecting our wing element profiles from Justification for Aerodynamics I started optimizing the 2D placement of the wing elements, starting with the front wing.
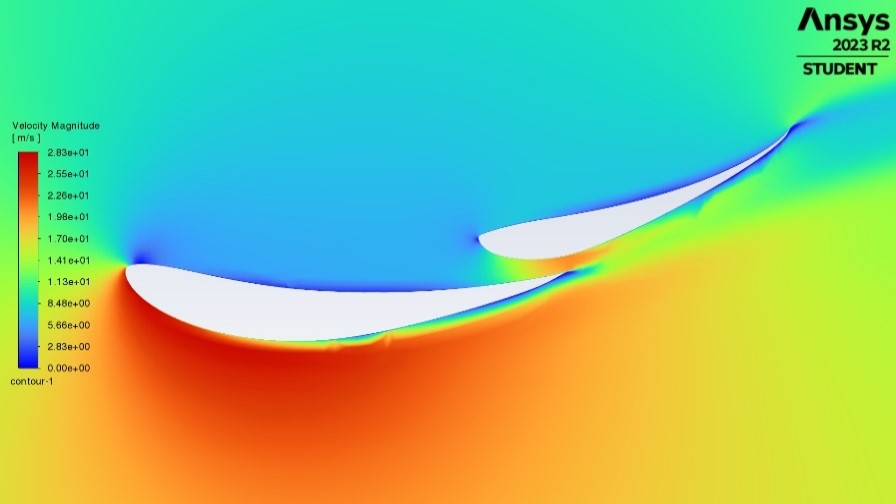
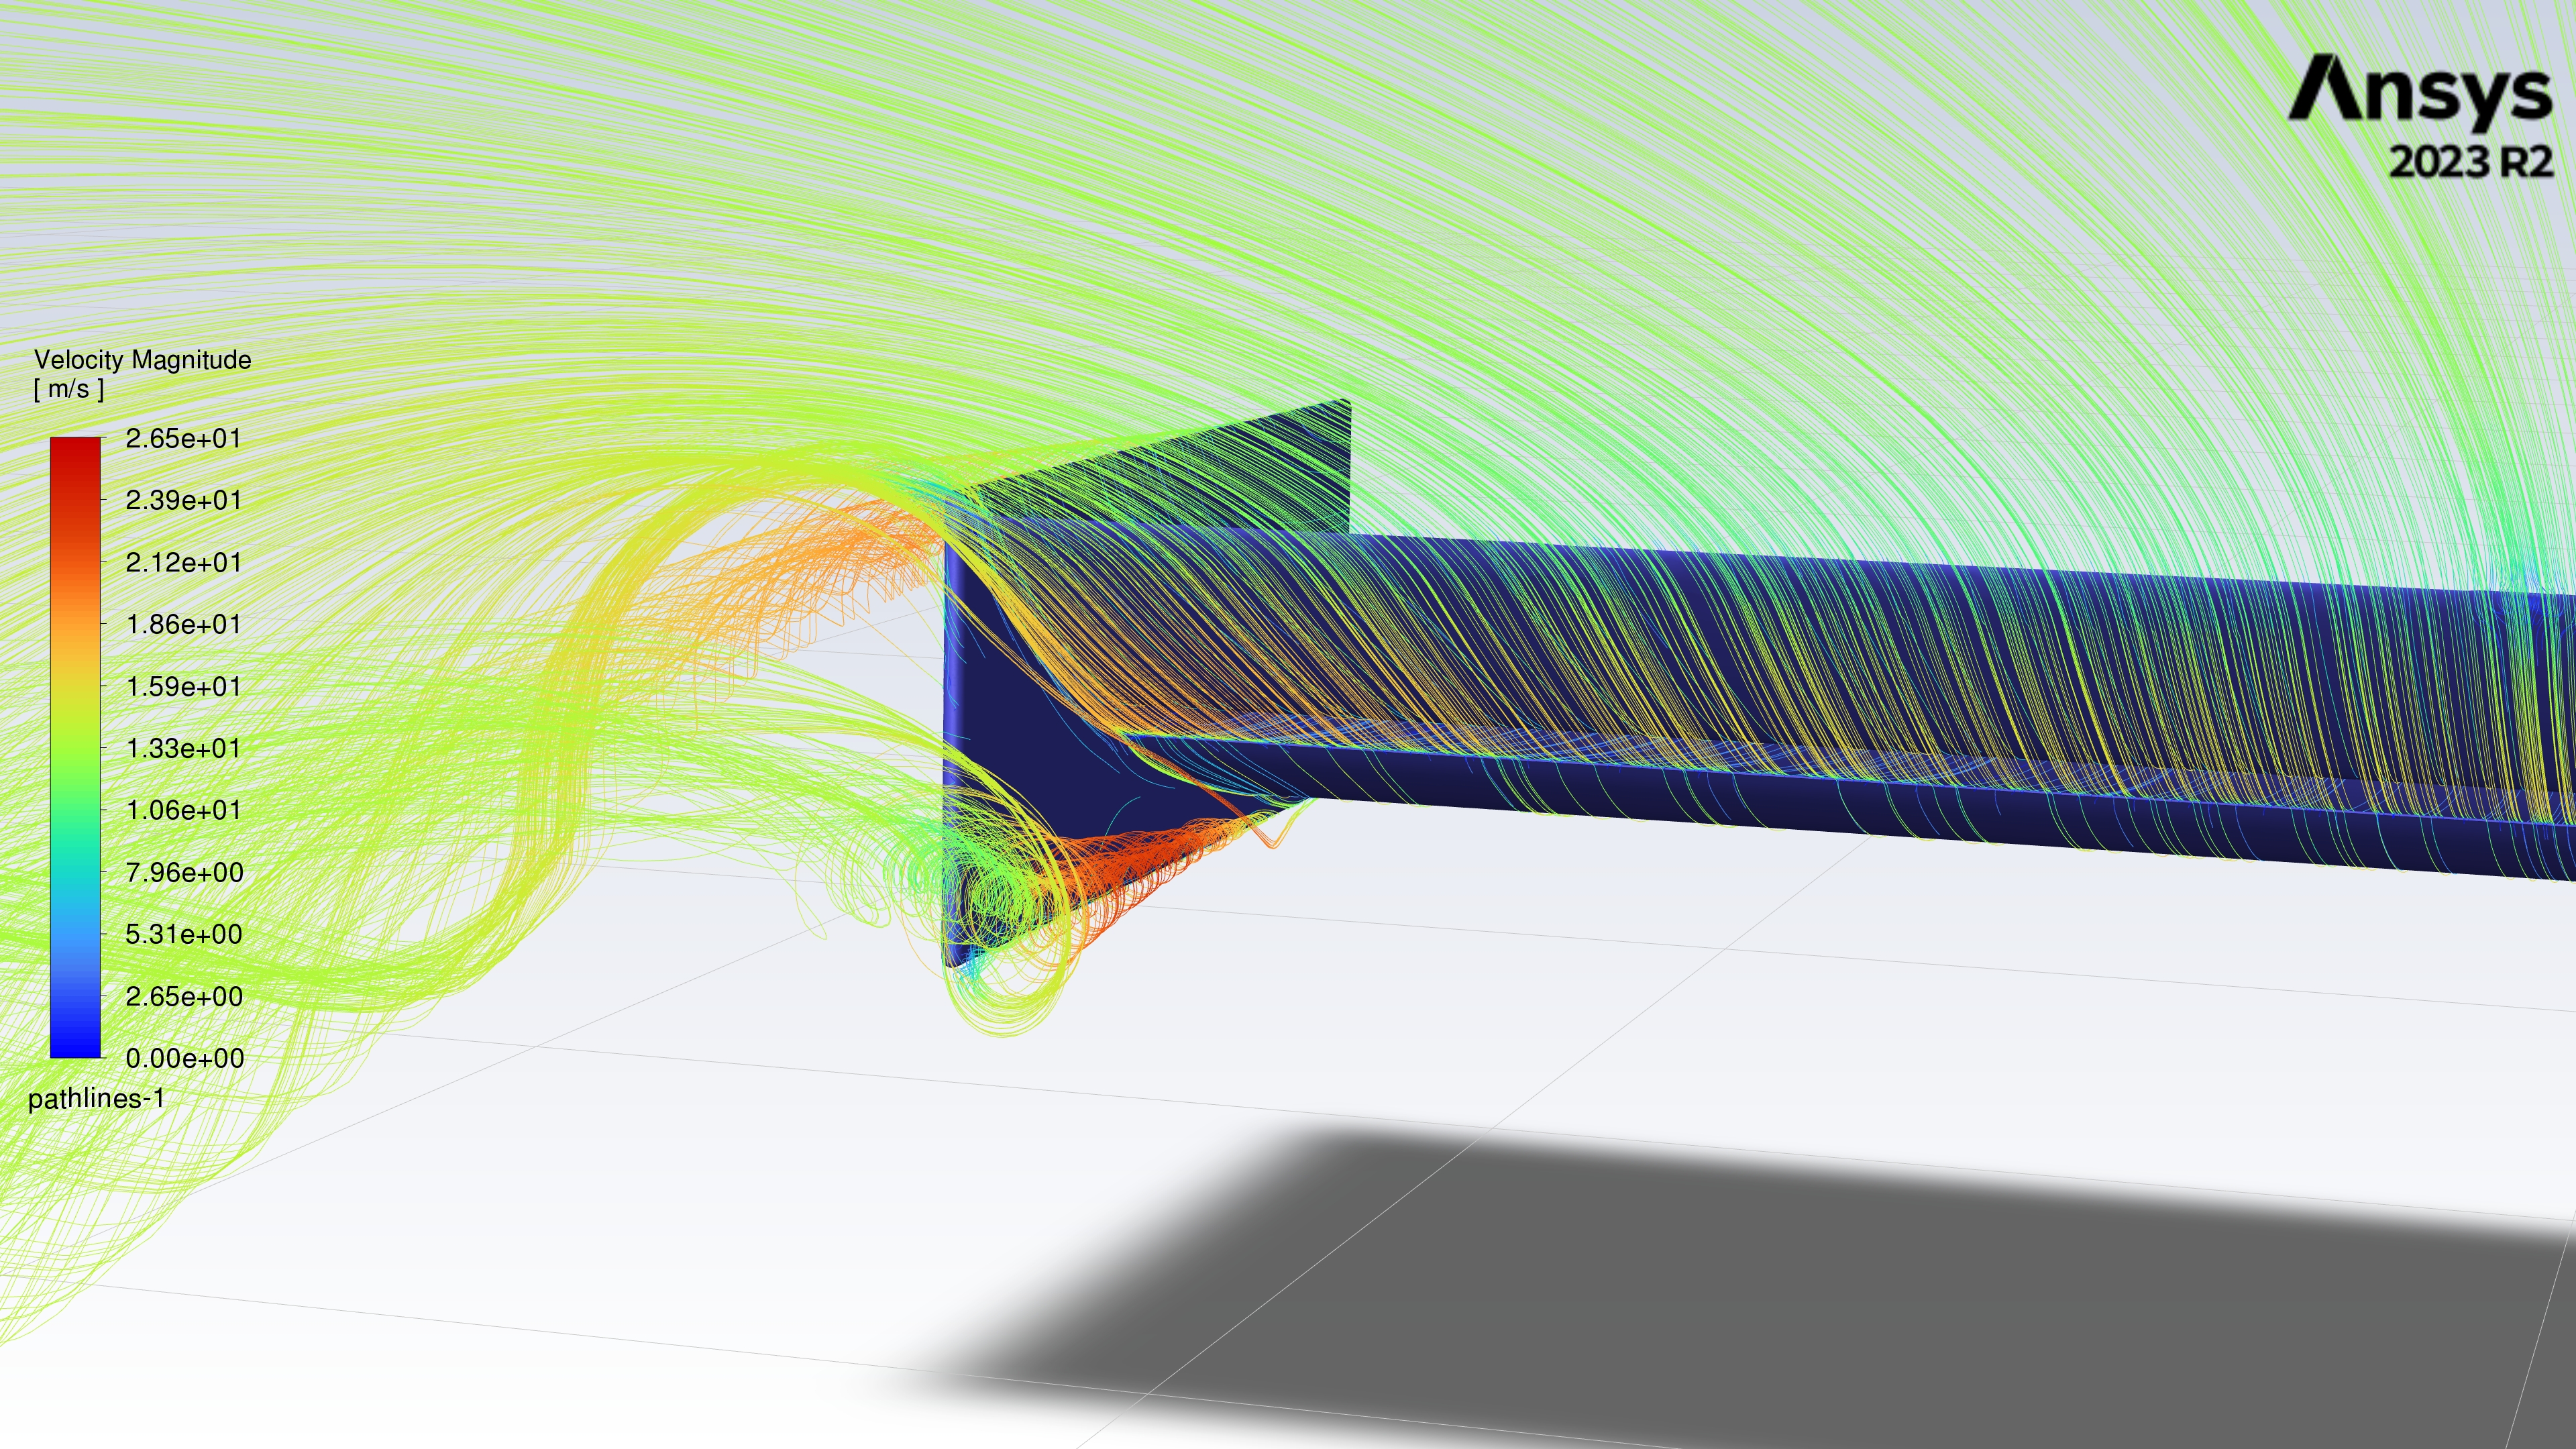
I kept the primary element at its minimum AoA given in the optimal free stream ranges I found, as this would lead to more vertical clearance to fit the secondary element inside the bounding box at a higher AoA. Keeping the primary element at its minimum AoA also meant enhanced ground effect since a larger portion of the chord would be closer to the ground.
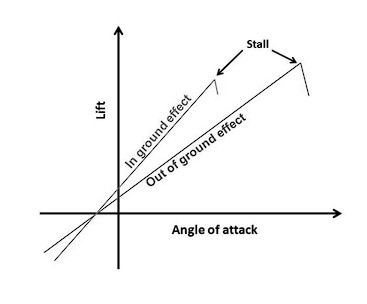
Fig. 1 Ground Effect
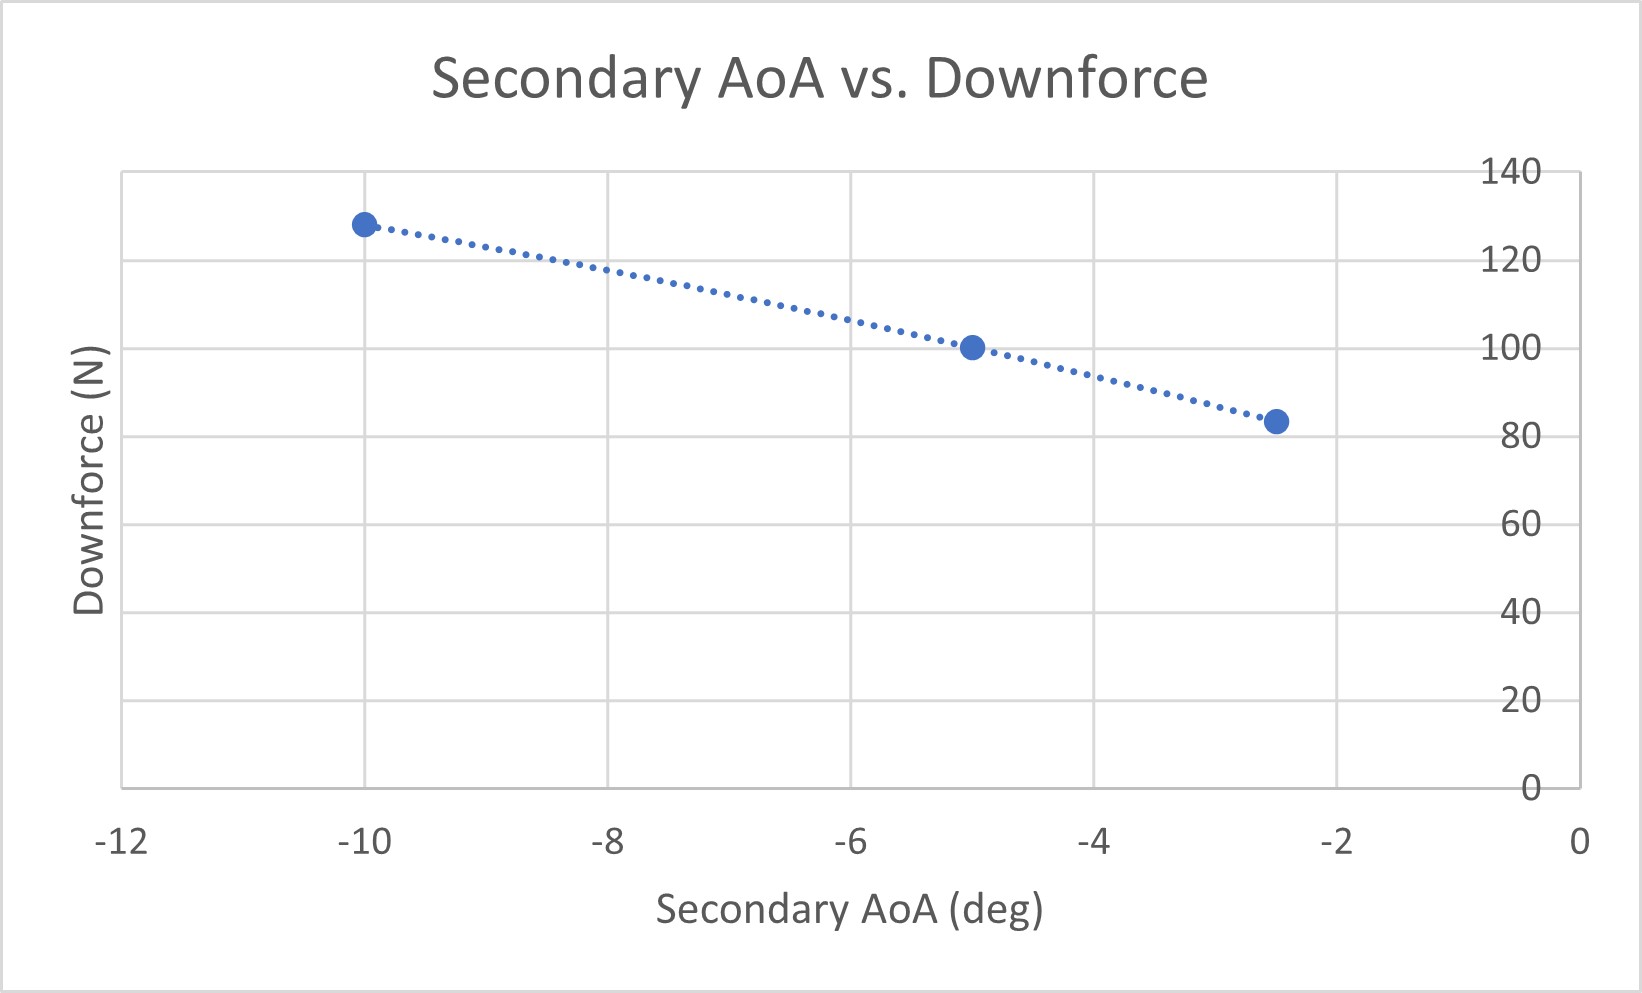
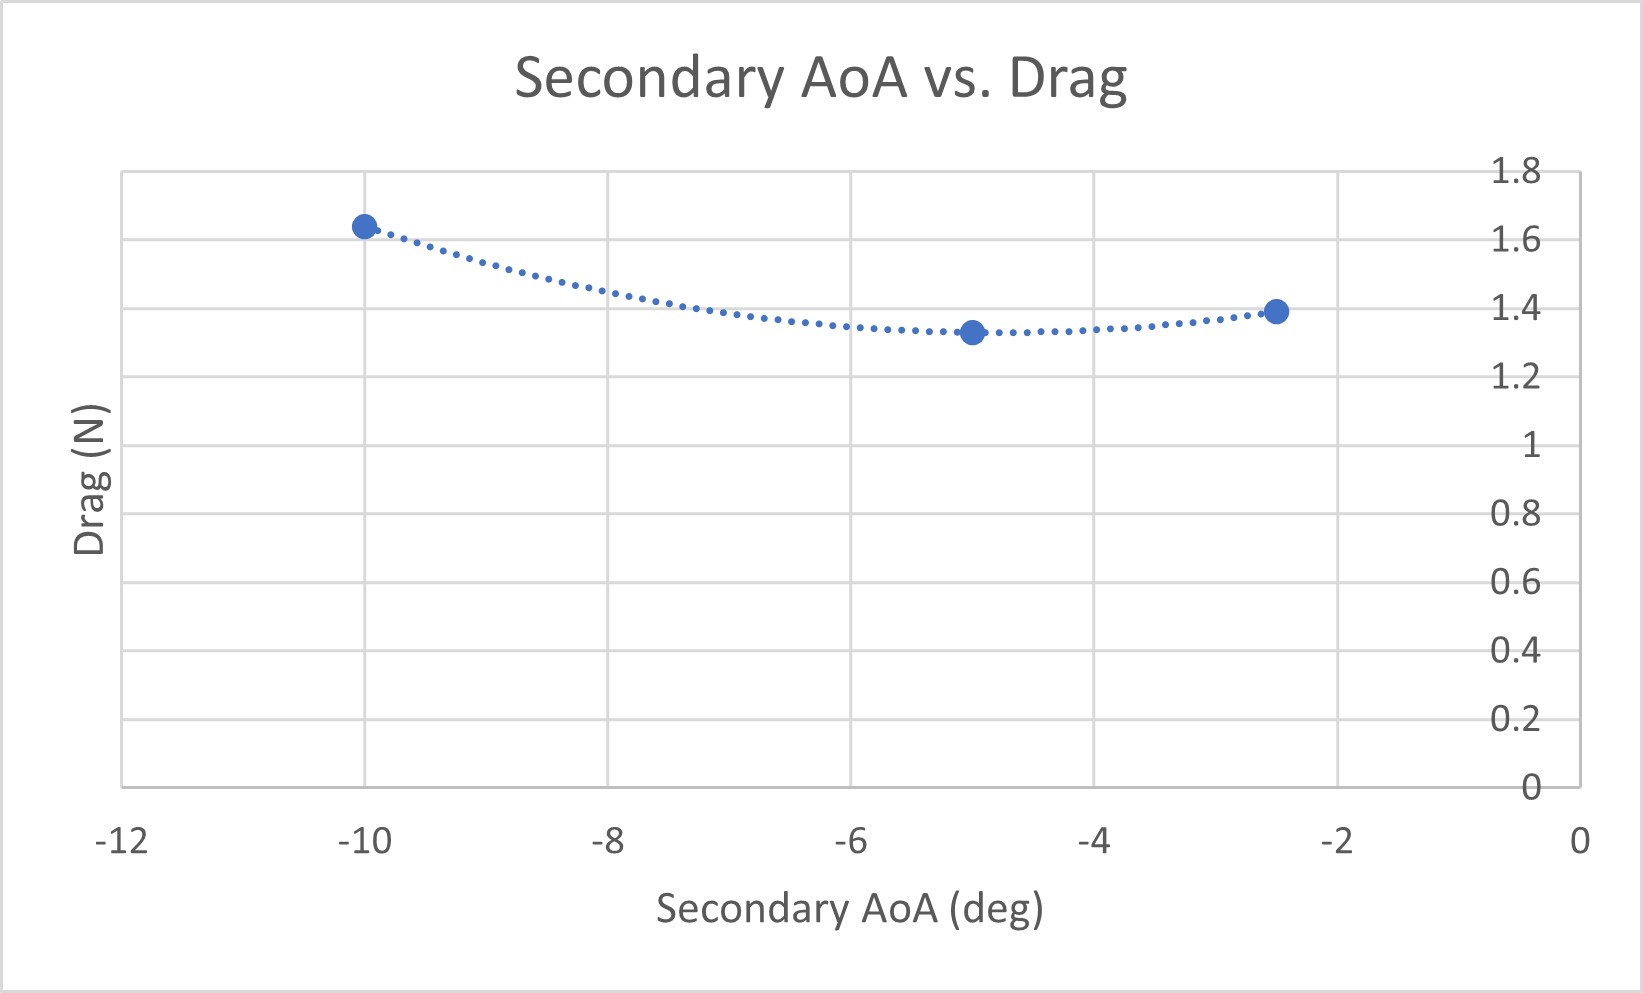
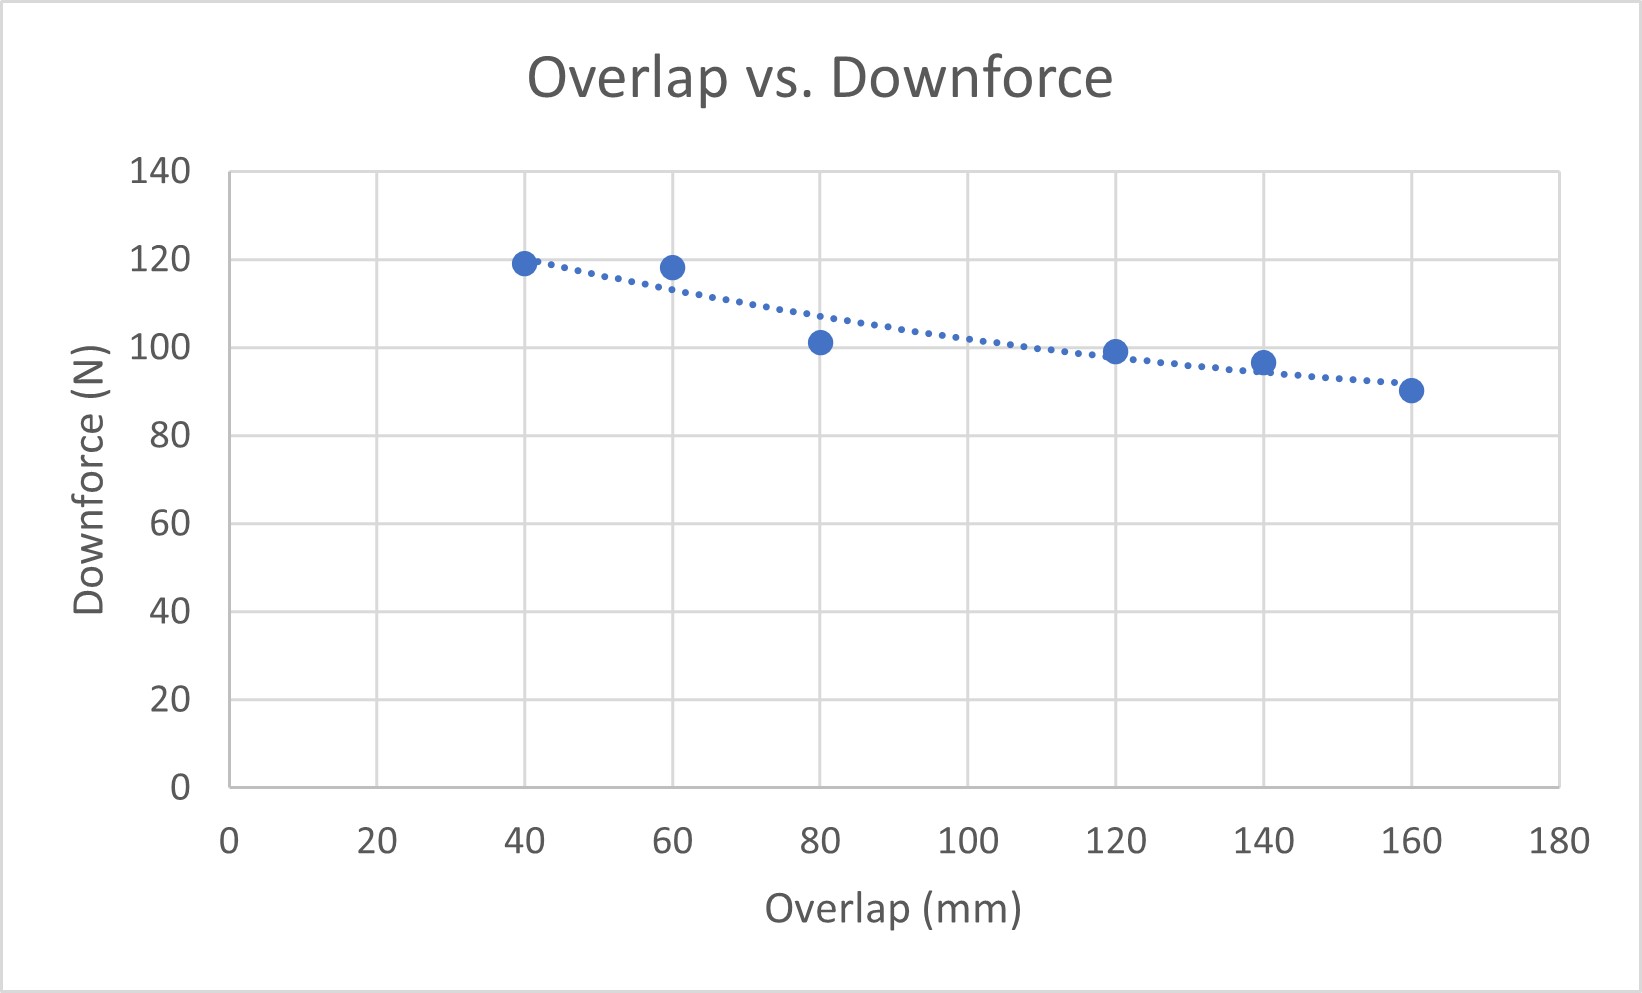
Due to the internal design freeze being December 10th, I unfortunately did not have time this year to pursue an iterative MATLAB algorithm to determine the optimal wing setup given some basic parameters like the bounding box, air speed, and target L/D ratio. This is typically what teams do. Instead, we brute forced our way through it and ran 45 2D CFD simulations in Ansys Fluent to draw some general conclusions about what we should change if we want more downforce and less drag.
 |
 |
 |
 |
 |
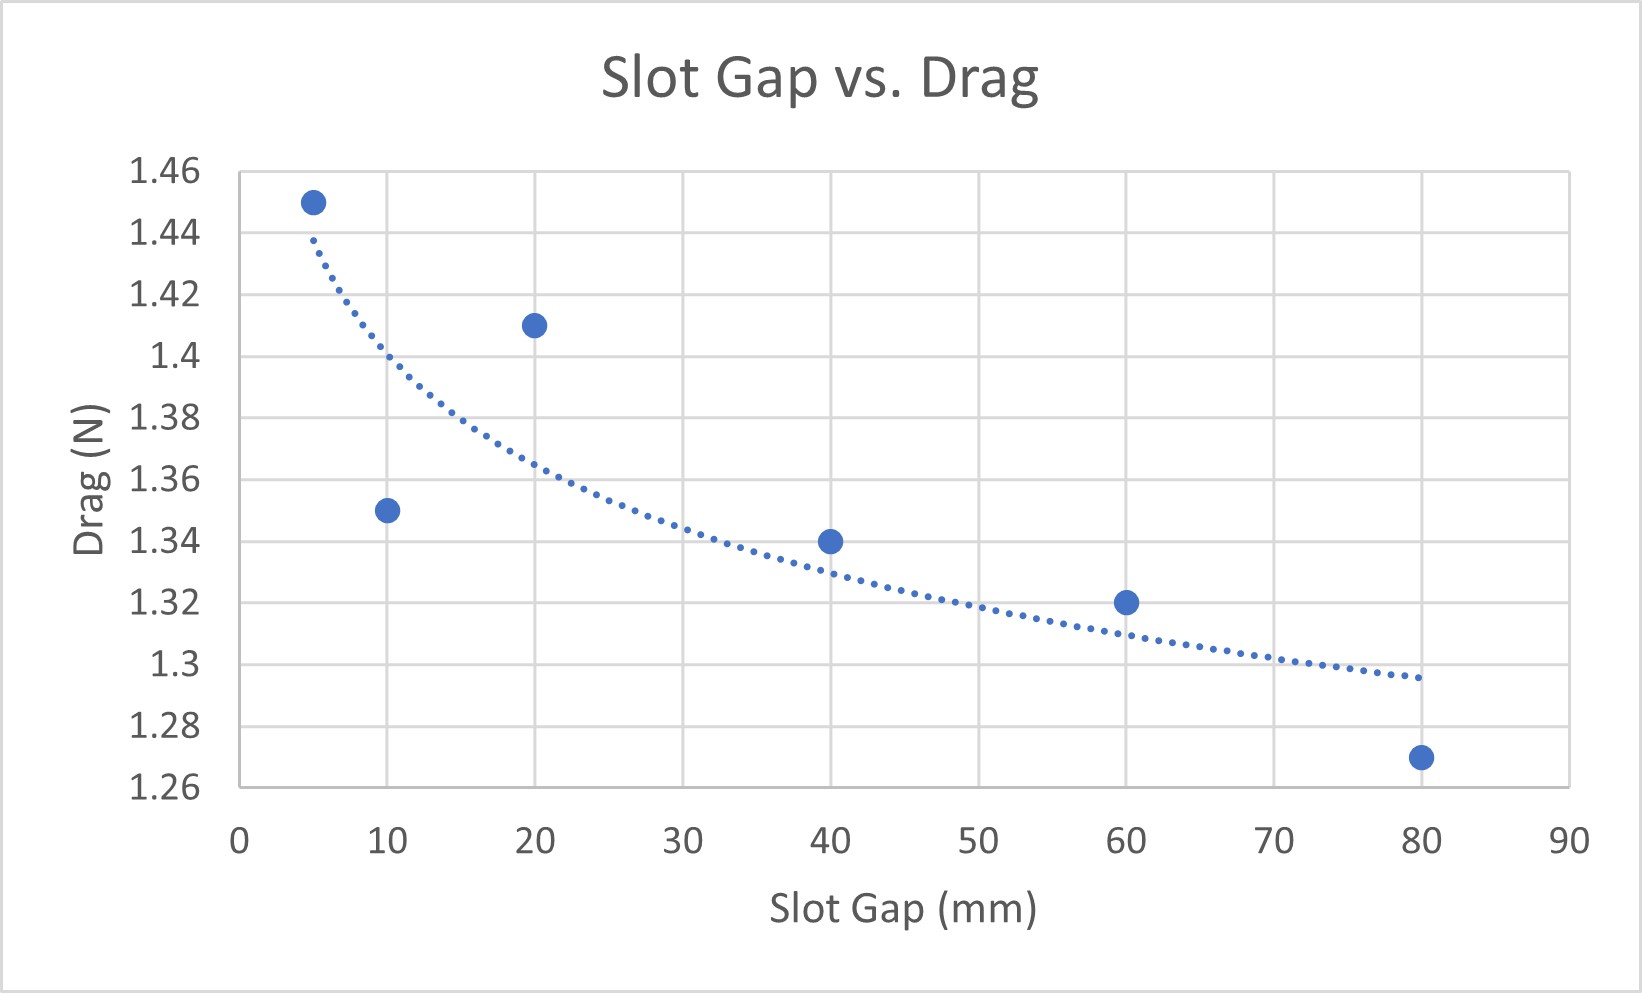 |
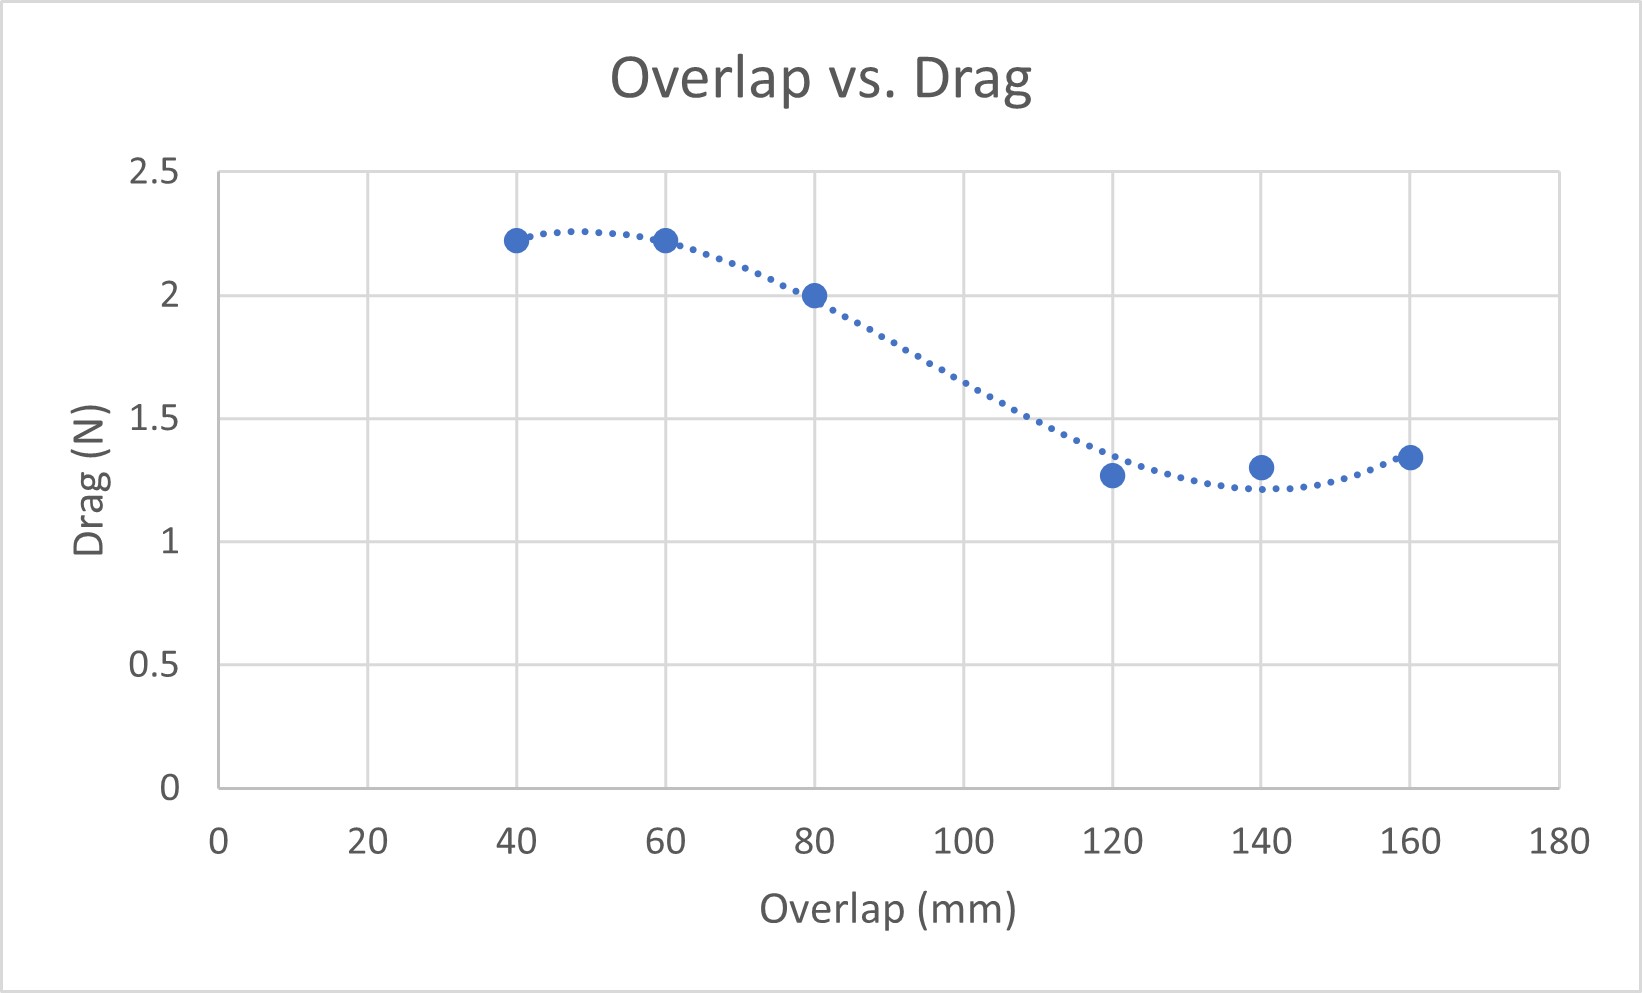
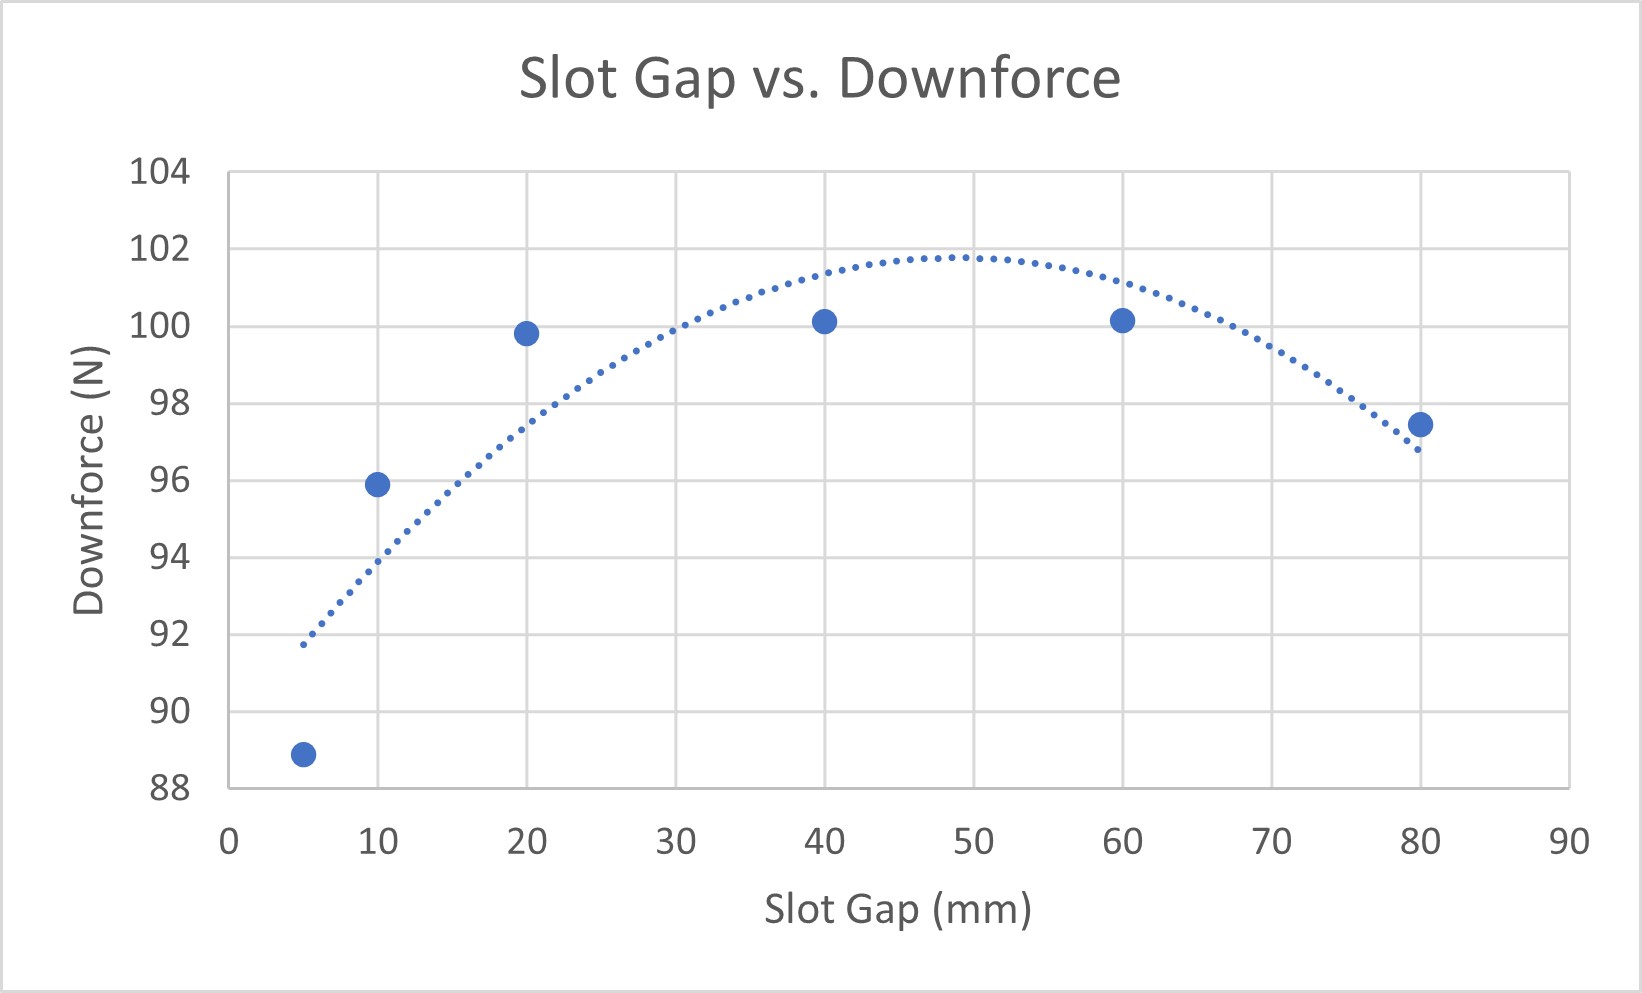
Figs. 2, 3, 4, 5, 6, and 7 General trends of airfoil parameters. We isolated one parameter (e.g. AoA) and kept the others constant (e.g. overlap and slot gap) to understand the effects of each parameter
Using these general trends we tested combinations of these parameters to try and achieve the highest amount of downforce. Since the plan is to only use wings this year, achieving our target of Cl=4.6 will require some aggressive setups. 4.6 may not even be possible with just wings, especially since we don’t have time to optimize the lift of the chassis, however we want to see how close we can get.
Eventually, through more 2D CFD at 13.33mps, we converged to preliminary setups for the front and rear wings.
 |
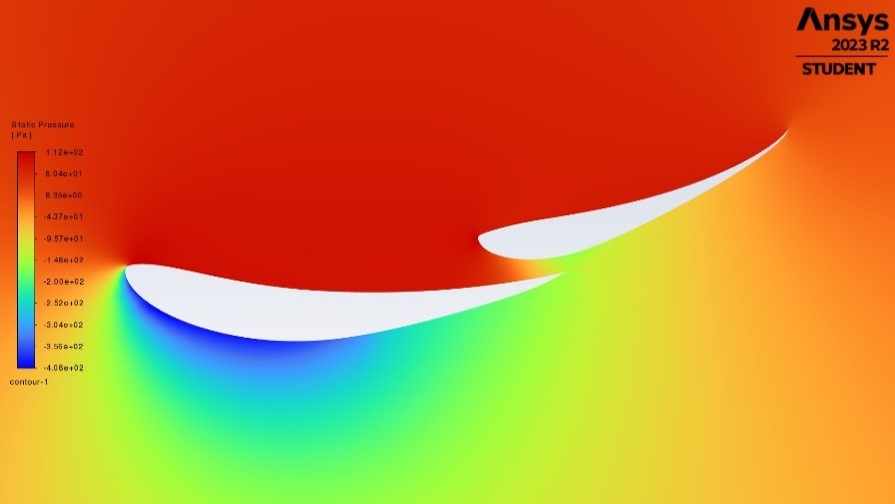 |
| Downforce (N) | 186.85 |
| Drag (N) | 2.22 |
Table 1 Front wing velocity and pressure contour plots
 |
 |
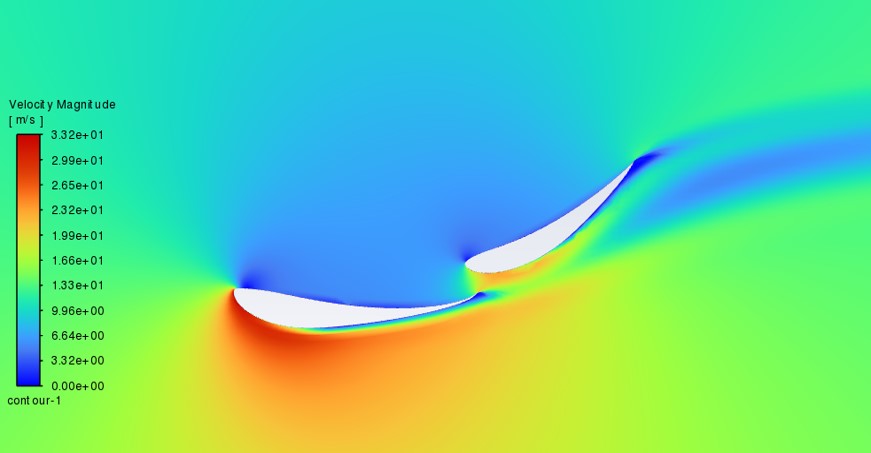
| Downforce (N) | 224.40 |
| Drag (N) | 4.83 |
Table 2 Rear wing velocity and pressure contour plots
Preliminary Endplate Designs
With the wing setups optimized, I turned my attention to justifying and modelling preliminary endplates.
Endplates are commonplace in race car aerodynamics, however I still wanted to quantify change in downforce and drag with and without endplates to be thorough. I want future members to understand why we are spending extra money and man power to manufacture endplates.
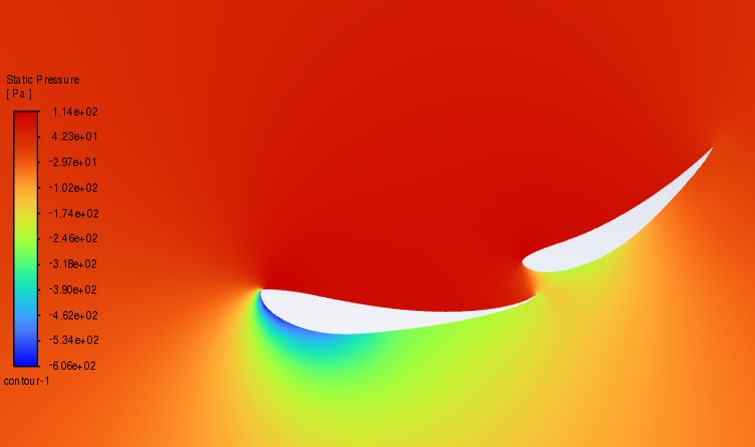
| w/o Endplates | w/ Flat Endplates | |
| Images | 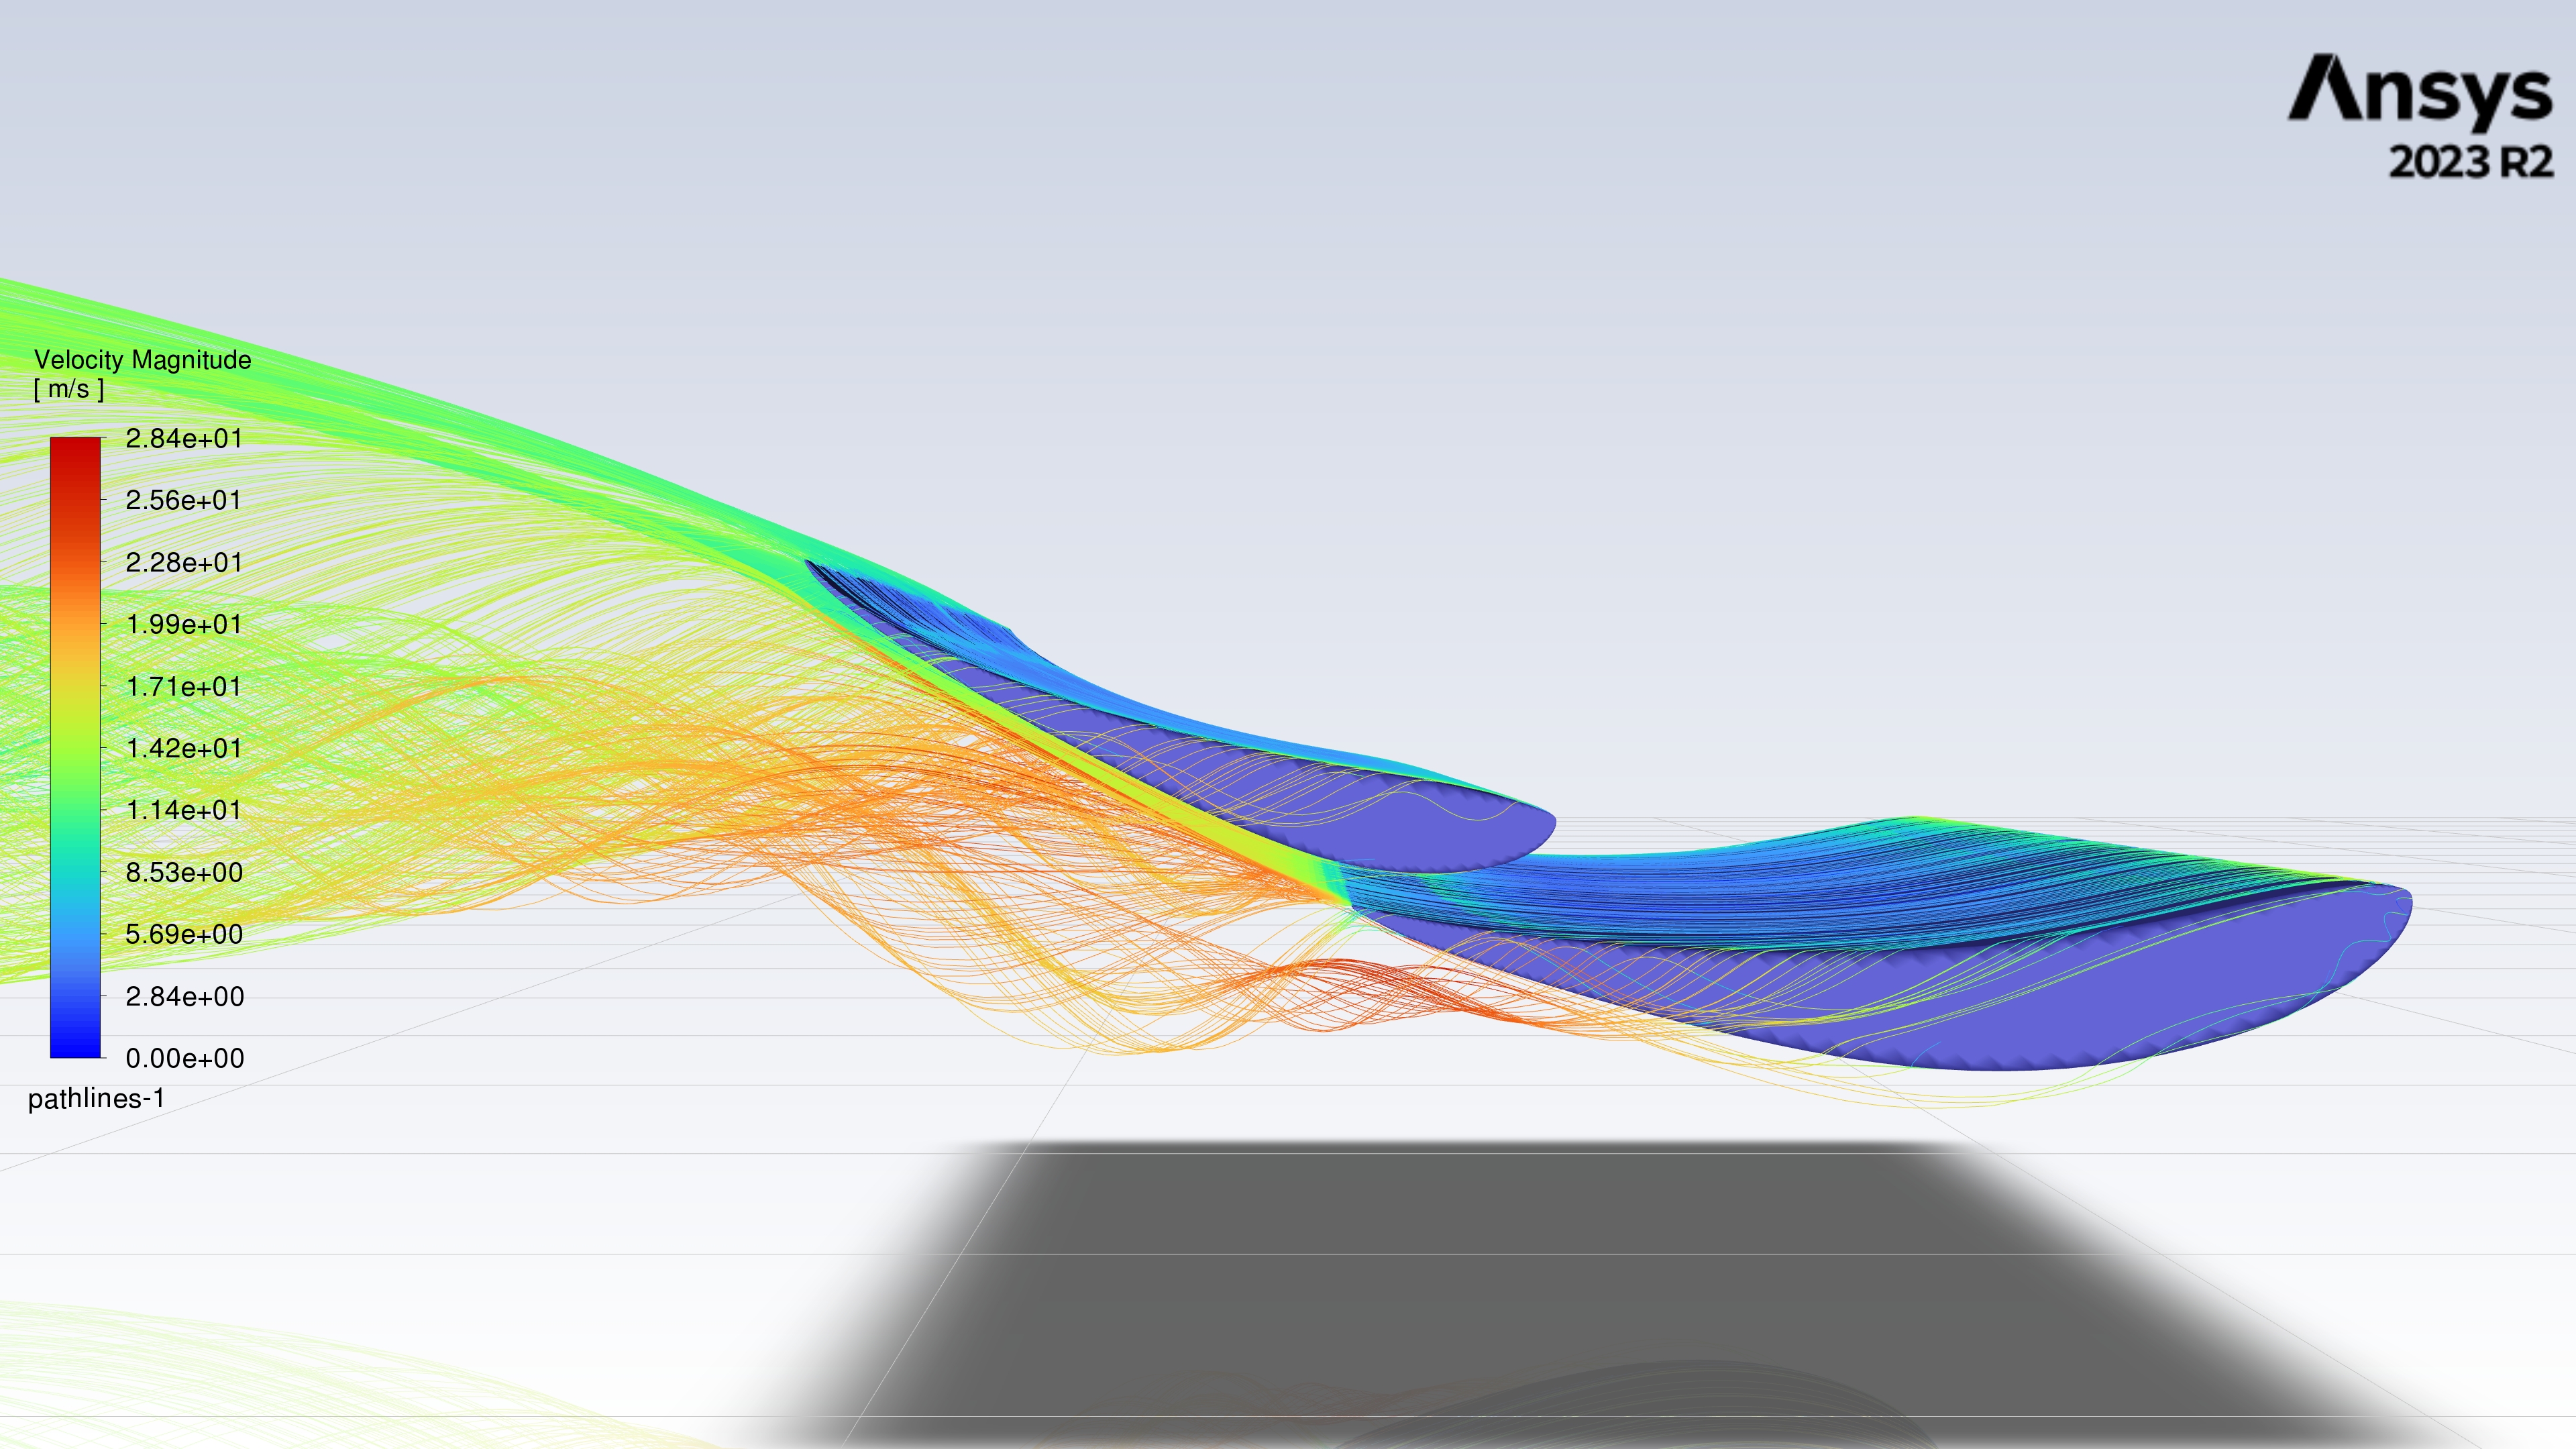 |
 |
| Cl (-) | -5.21 | -5.65 |
| Cd (-) | 0.93 | 0.91 |
Table 3 Front wing with and without endplates. Reduced flow mixing with endplates improves downforce and drag
Optimizing endplate geometry to reduced induced drag from the wingtip vortices will be explored in the full car, 3D analysis. For now, both the front and rear wings receive flat endplates.
The rear wing receives larger endplates since we found through 3D CFD this improves the L/D of the wing from 4.04 (10mm buffer around edges of wing setup) to 4.66 (endplate extends 300mm below wing setup).
Nose Cone Design
Going into this I was very curious about a blunt-edge vs. pointy nose cone for a FSAE car.
I’m pretty into old, legendary military fighters and love learning about how they pioneered modern day, agile interceptor aerodynamics. Don’t get me wrong, the F-35s philosophy of mission intelligence and networking is stunning, however it’s hard to not be attracted to the raw power and agility of a F-16…
Apart from the long, vortex-generating leading edge strakes that make the F-16 look like it has jacked oblique muscles, another distinctive feature is that extremely pointed nose cone.
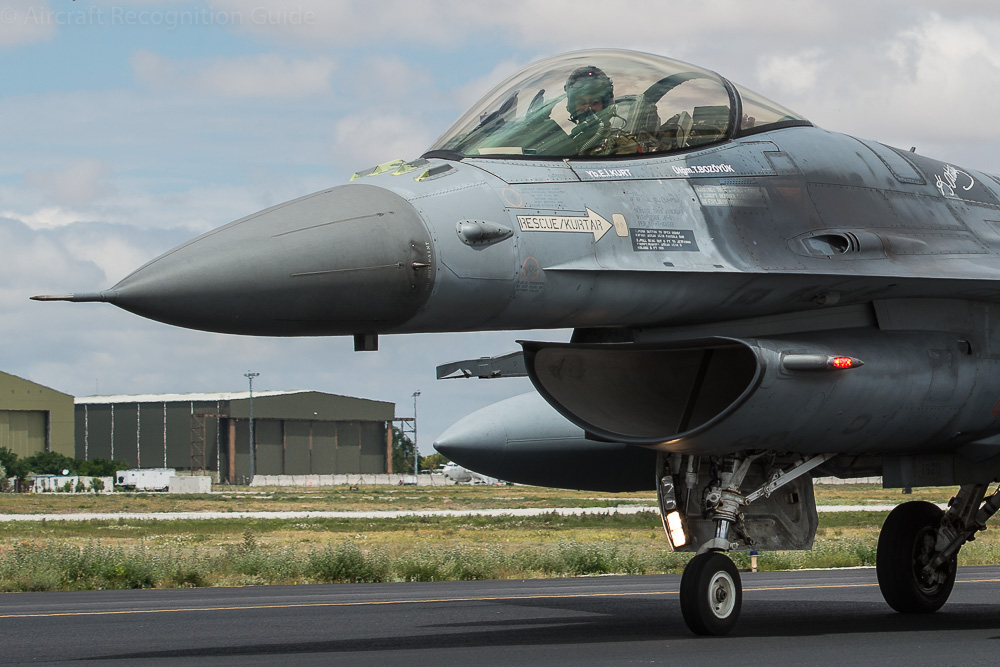
Fig. 8 F-16 nose cone
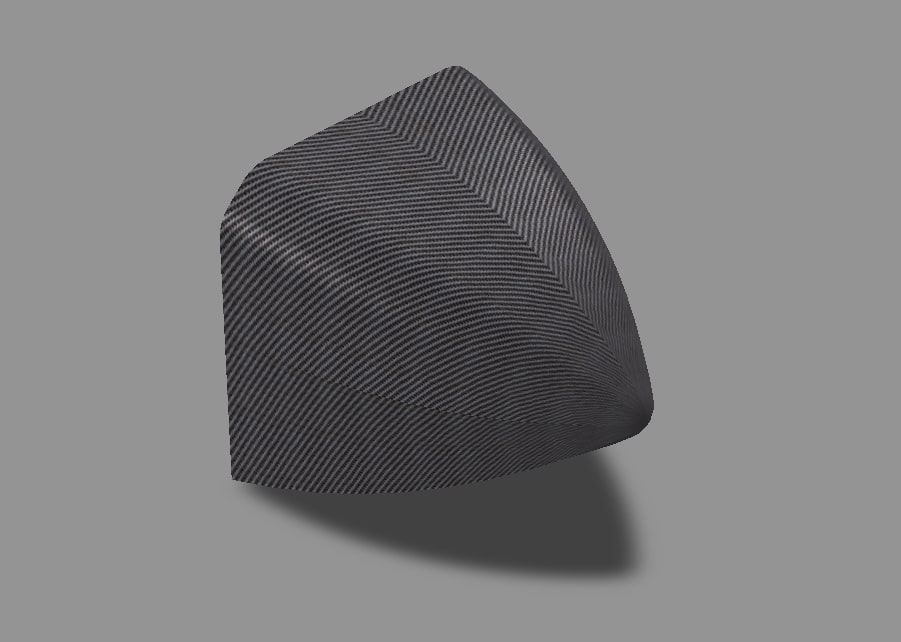
I do understand that pointed noses work best at super-sonic speeds, however I couldn’t resist jumping into Ansys to see what would happen if I simulated a pointy nose cone at 13.33mps. Below are the results relative to a blunt-edge nose cone.
| Blunt-Edge Nose Cone | Pointy Nose Cone | |
| Images | 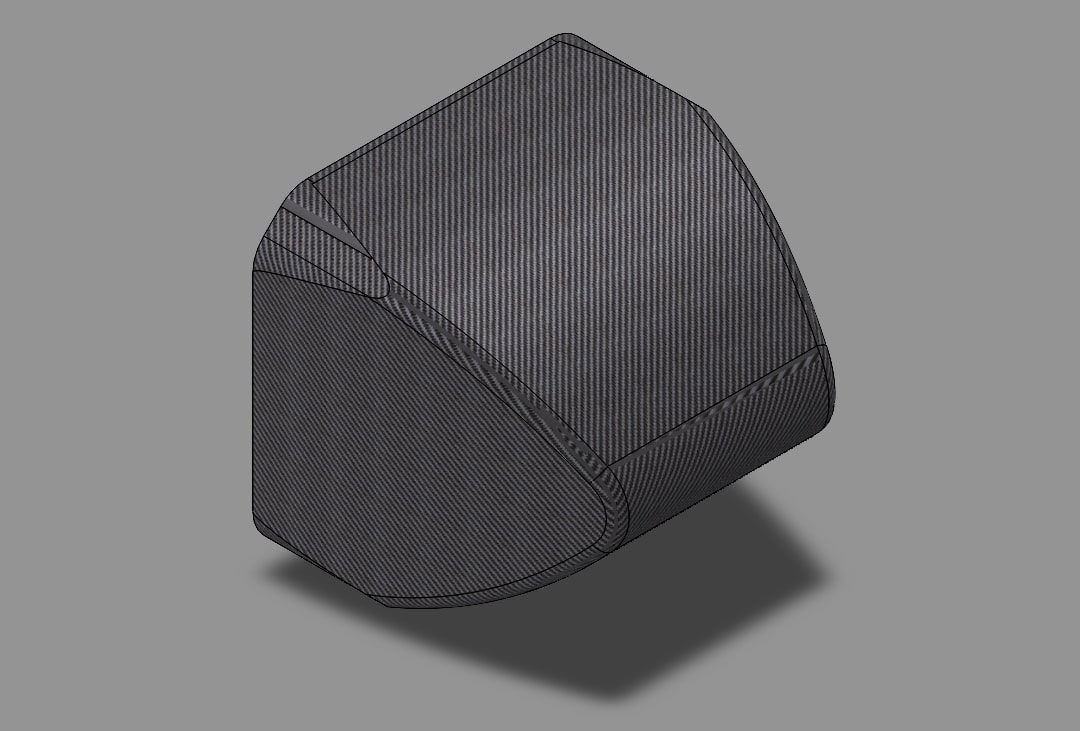 |
 |
| Cd (-) | 0.14 | 0.11 |
Table 4 Blunt-Edge vs. Pointy Nose Cone
At the current point in time it’s hard to say whether I got lucky and stumbled upon a low drag geometry, or if pointy nose cones are the way to go for all FSAE applications. Answering that question requires further analysis and simulating many more models with different curves. However, at the current point in time we will be going with the pointy nose cone for its reduced drag coefficient.