Justification for Aerodynamics
The past month and a half has been extremely busy…
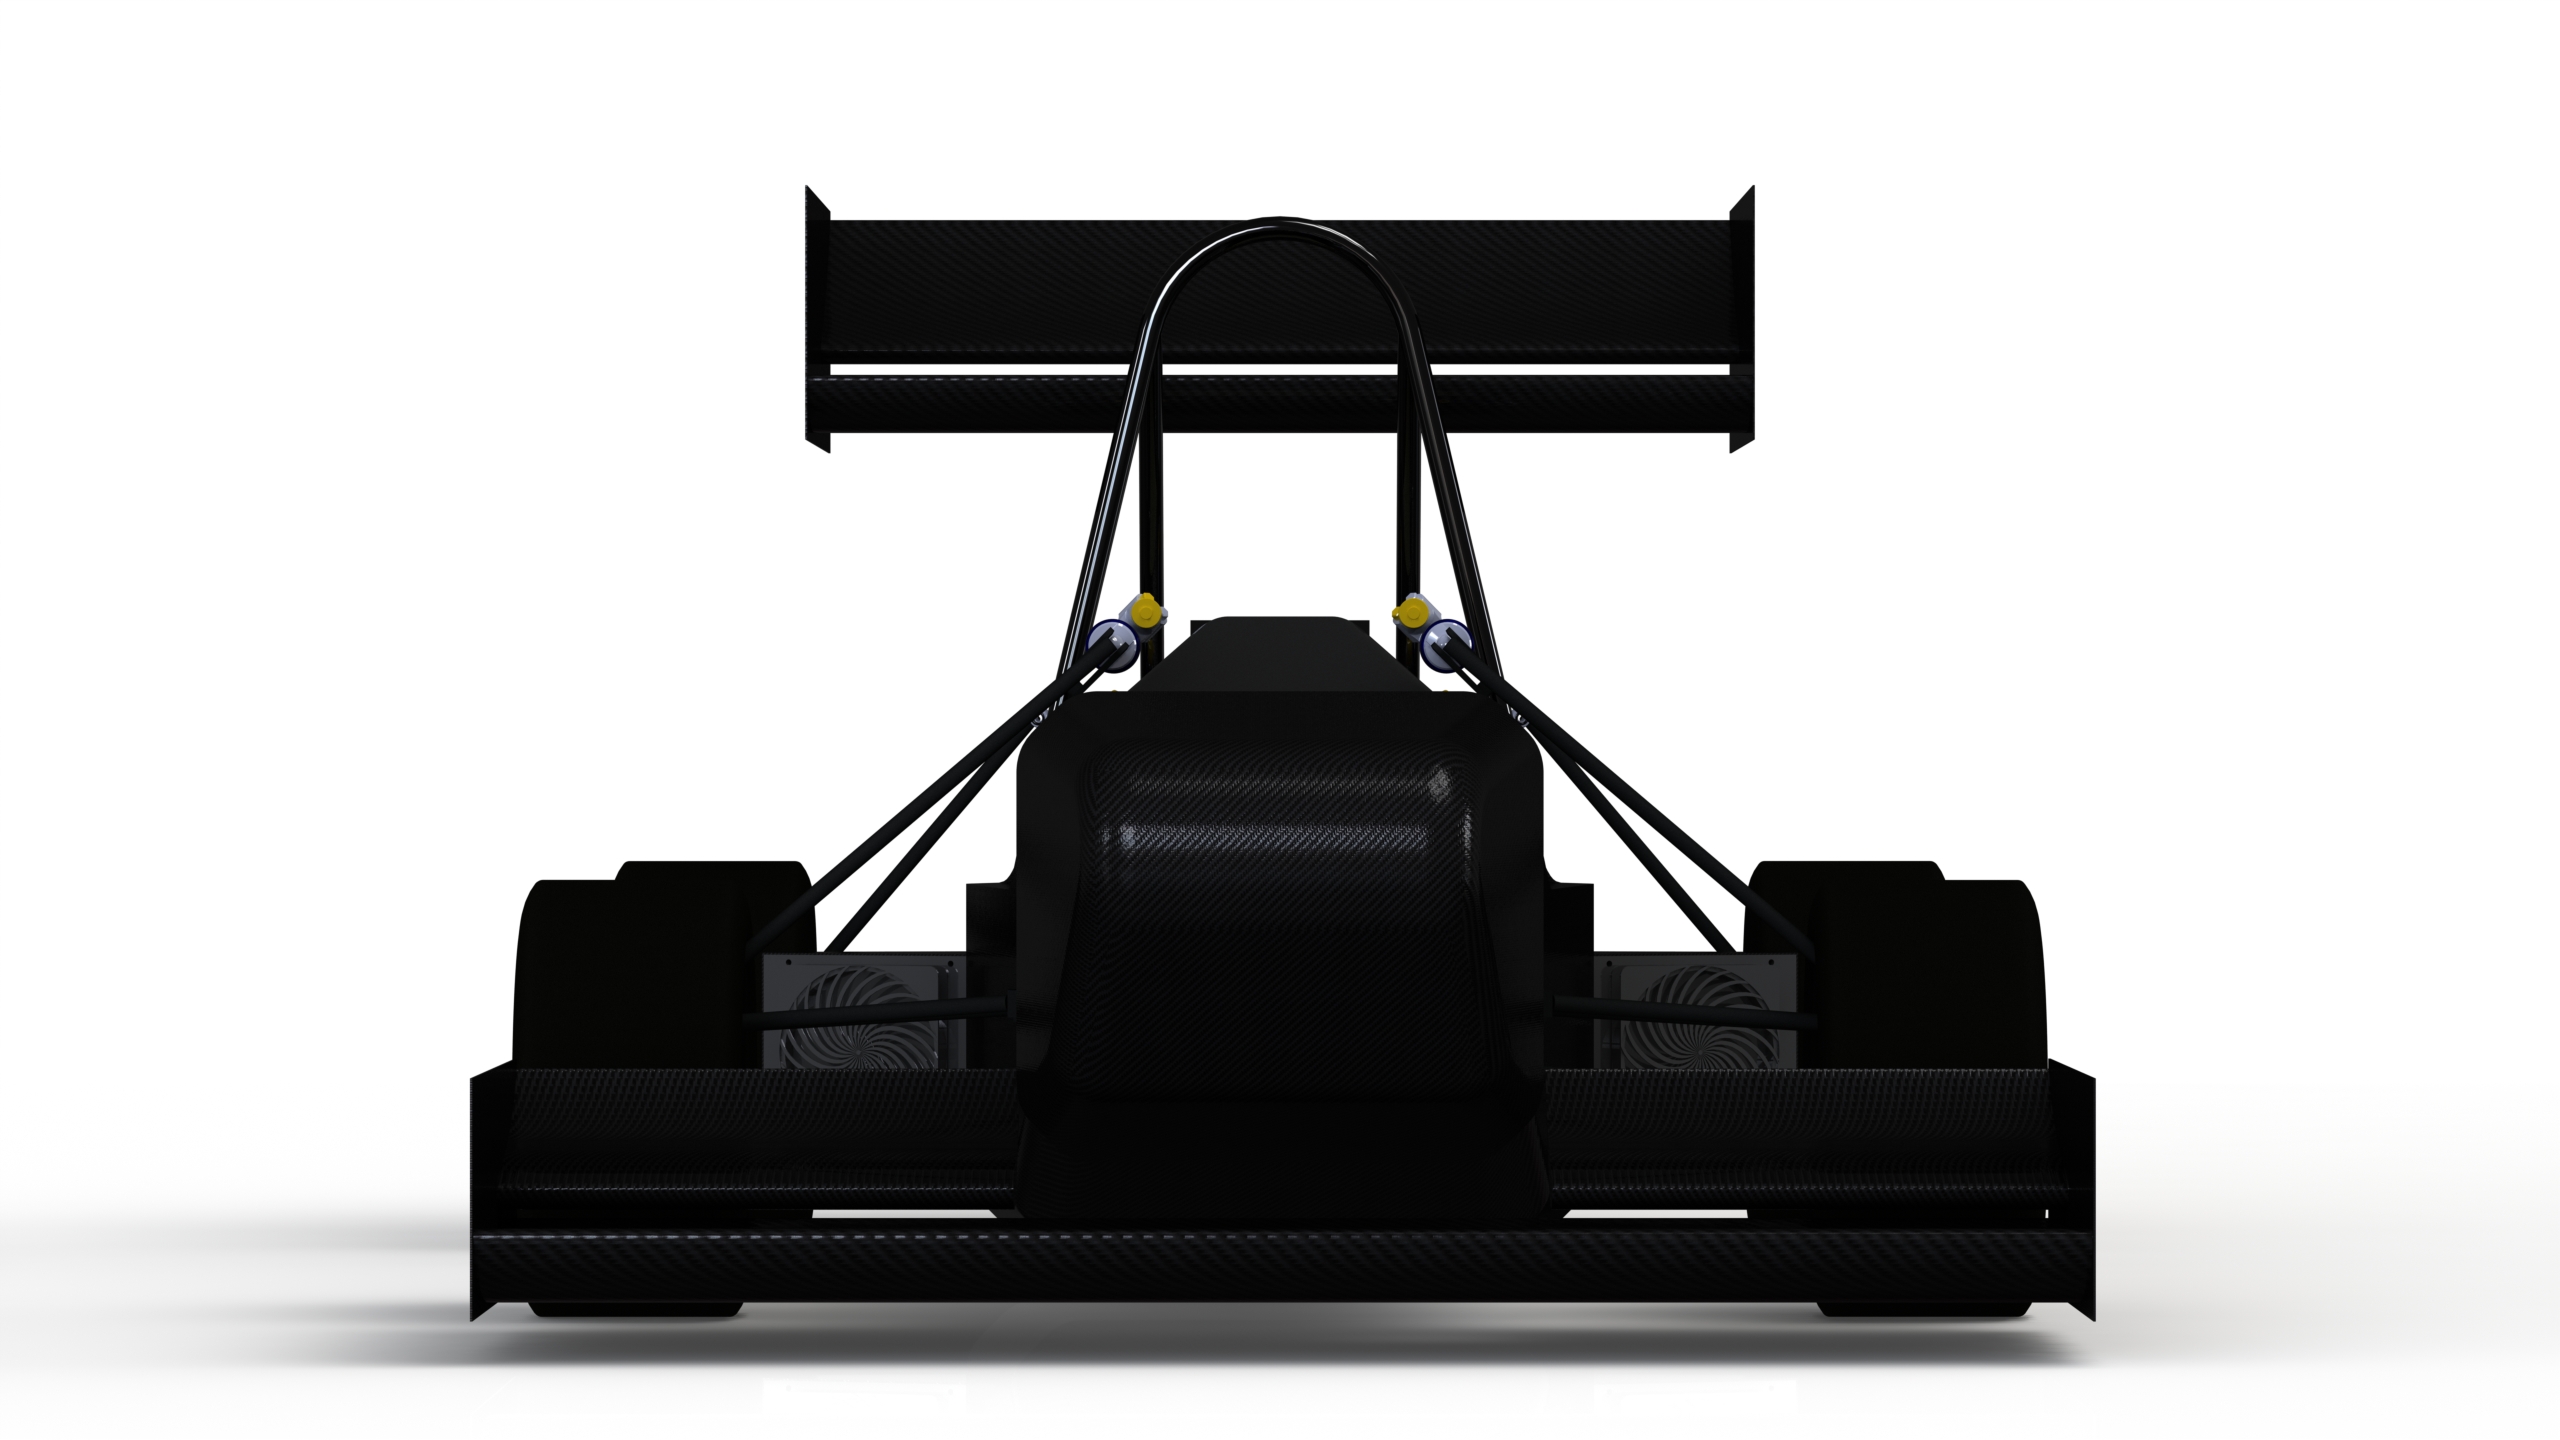
Fig. 1 Preliminary Render of EV5 Concept
It’s All About Tires
Increasing the normal force increases the lateral force at a given slip angle. What EV5’s operating slip angle range is needs to be determined, however this fundamental principle is the basis on which I am going to be developing the aerodynamics package. Some raw data from the FSAE TTC for my teams’ tires can be seen in the image below.
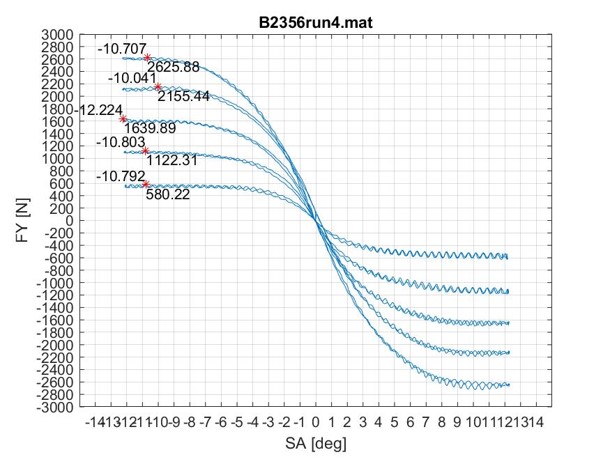
Fig. 2 Hoosier 43075 w/ 7" Rim Width
From here I can interpolate % changes in lateral force with and without theoretical aerodynamic devices, assuming 196N (front wing) + 236N (rear wing) of downforce at 13.33mps from a preliminary JavaFoil simulation with a dual-element airfoil setup. I determined 13.33mps is the average FSAE Michigan endurance cornering speed through competitive analysis (i.e. many, many hours of YouTube onboards watched and many, many papers read…)
| Slip Angle (deg) | Lateral Force w/o Aerodynamics (N) | Lateral Force w/ Aerodynamics (N) | Change in Lateral Force (%) |
| 1 | 404 | 436.4 | 8.02% |
| 2 | 578.7 | 626.76 | 8.30% |
| 3 | 759.65 | 830.12 | 9.28% |
From the % changes it’s clear to see the improvement aerodynamic devices could make in lateral force.
Faster in the Corners, Slower on the Straights
Quantifying the change in performance in tires is important, but ensuring laptime is more sensitive to downforce rather than drag is equally as important. For this reason we developed an in-house lap simulation program using MATLAB, since I would not be able to generate the required graph from OptimumLap. Full credits go to Sepehr Makarian Abdolahi for writing this program to quantify design constraints for the aerodynamics and powertrain subsystems of MAC EV5.
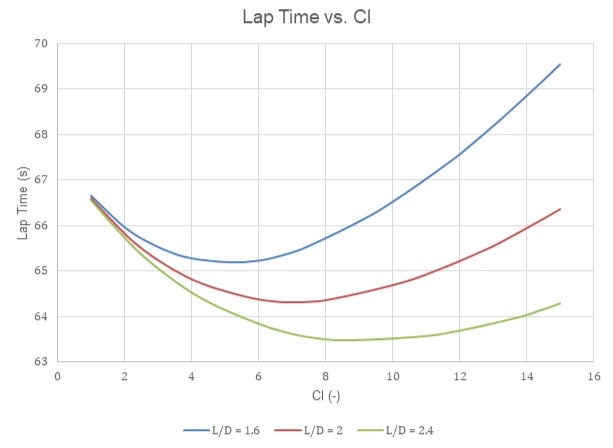
Fig. 3 Lap Time vs. Cl for Various L/D Ratios
This graph alone doesn’t provide us with the Cd*A constraint required to start pursuing aerodynamic design. We also need to consider the fact that since the vehicle is electric, the energy density will be much lower than an ICE and ensuring minimal aerodynamic drag is essential to a successful design.
We generate a list of the power consumed for increasing Cl at L/D=2.4. Accumulator size is 6.2kWh and we assume 2kWh of regen per lap, which is a safe assumption to make after a discussion with the powertrain subteam and their goal this season to implement regen.
| Cl(-) | Lap Time (s) | Power(kWh) |
| 4.3 | 64.716 | 6.069 |
| 4.4 | 64.676 | 6.105 |
| 4.5 | 64.636 | 6.134 |
| 4.6 | 64.597 | 6.180 |
Table 1 Excerpt taken from MATLAB output. Assumed efficiencies are as follows: controller=98%, accumulator=90%, drivetrain=87%, motors=95%. Total efficiency=72.90%. Estimated reference area (frontal area)=1.19m^2
Now we have a set target of Cl=4.6 and Cd=1.92, or more useful ClA=5.47 and CdA=2.28 with A=1.19m^2. These are admittedly very high values, especially for a team pursuing aerodynamic devices for the first time. However, we at least now know our drag ceiling that we can’t exceed out of fear of running out of energy before endurance ends. During design we will aim as high as we can go without exceeding the Cl and Cd threshold.
Airfoil Selection
The design philosophy this year is to keep it simple. No DRS, 10-element wings, sidepods, or Newey-esc undertrays. I simply want to understand everything there is to know about airfoils and airfoil selection before we pursue further devices. After all, bolting on a part you don’t understand is worse than not bolting on the part at all. The goal is to be competitive and learn, not either or.
Since we want to keep it simple, we decided not to pursue our own airfoil design and instead look at commonly used FSAE airfoils. Some Google searches later and we converged to the NACA 6412 and 4412, Selig S1223, and Eppler E423.
To simplify polar plot analysis, I made some preliminary assumptions based on the aerodynamic bounding boxes from FSAE Rules 2024 V1 T.7.7.2.
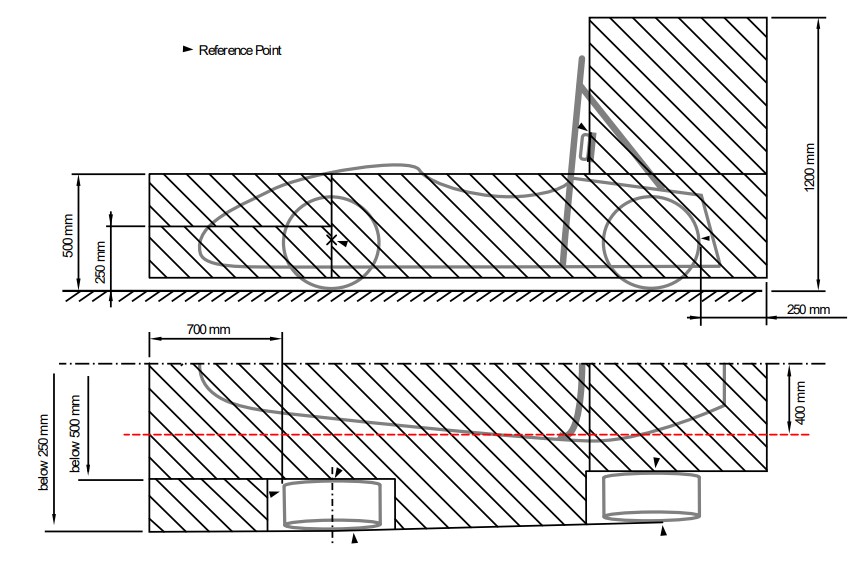
Fig. 4 T.7.7.2
| Front Wing Primary Element | Front Wing Secondary Element | Rear Wing Primary Element | Rear Wing Secondary Element | |
| Chord (mm) | 400 | 300 | 500 | 400 |
| Re (-) | 352,856 | 264,642 | 441,069 | 352,856 |
Table 2 Air speed=13.33mps and NCrit=9 since it is commonly used. More wing elements can be pursued if more downforce is required to hit the initial design target of Cl=4.6
After making these assumptions, I began to look at the polar plots of these airfoils at on airfoiltools.com. The objective(s) of each wing element are summarized below.
| Front Wing Elements | Rear Wing Primary Element | Rear Wing Secondary Element | |
| Objective(s) | High downforce at low AoA | High downforce | High downforce at maximum L/D |
| Reasoning | Want to minimize upwash, since more upwash would make it harder to direct airflow to other areas of the car (e.g. radiator(s), rear wing, etc.) during the design phase | From T.7.7.2, the bounding box for the rear wing is larger than the front wing, meaning we can have a larger rear wing, meaning more downforce. We should capitalize on this rule and ensure the rear wing produces a lot of downforce to meet our design target, which is why we will pay less attention to the AoA and pay more attention to the raw, peak Cl. A more rearwards CoP will also mean a more stable, although understeery car at medium-to-high speeds | The secondary element will be more exposed to the free stream air as the main roll hoop falls away, so we want to still ensure high downforce without losing too much energy to drag |
| Relevant Polar Plots | Cl vs. Alpha, Cl/Cd vs. Alpha | Cl vs. Alpha | Cl vs. Alpha, Cl/Cd vs. Alpha |
Table 3 Qualitative analysis to determine high level wing objectives and plots relevant to said objectives
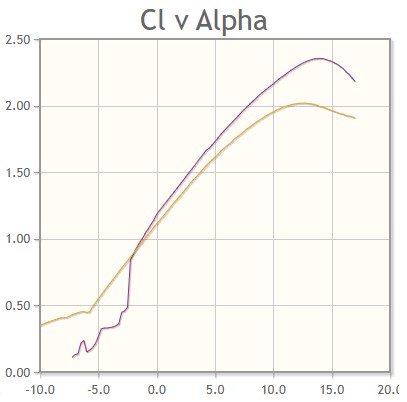
The Eppler E423 was a clear choice for the FWPE, as it had nearly as high a Cl as the highest Cl airfoil, the Selig S1223, while having the best L/D ratio at 5.0deg AoA, as can be seen in the 2 plots below.
 |
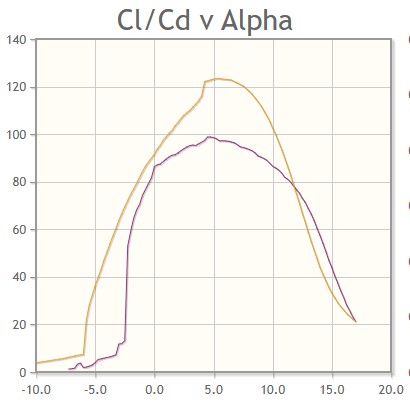 |
Figs. 5 and 6 S1223 and E423 at Re=500,000 (you can't input specific Re into airfoiltools.com unfortunately, so I had to round to the closest available Re)
This method of qualitative analysis was used to determine the profiles of the remaining elements, which can be seen in the summary table below along with their optimal free stream AoA ranges.
| Front Wing Primary Element | Front Wing Secondary Element | Rear Wing Primary Element | Rear Wing Secondary Element | |
| Profile | Eppler E423 | Selig S1223 | Selig S1223 | Eppler E423 |
| Chord (mm) | 400 | 300 | 500 | 400 |
| Optimal AoA Range for Cl/Cd at 13.33mps (deg) | -5.0 to 10 | -2.5 to 10 | 0 to 10 | 0 to 10 |
Table 4 Final airfoil profile selections for MAC EV5
I finished off our airfoil analysis by justifying dual-element wings, by comparing single-and-dual element setups with some quick 2D simulations in Ansys Fluent with the element profiles we just determined. Each profile was set to its maximum AoA given from Table 4.
| Wing Setup | Lift (N) | Drag (N) | Cl (-) | Cd (-) |
| Single-Element | -46.89 | 1.17 | -0.43 | 0.011 |
| Dual-Element | -179.36 | 5.25 | -1.65 | 0.048 |
Table 5 Single-Element vs. Dual-Element Wing Setups
We can clearly see there is a significant improvement in downforce as we increase the number of elements. Yes, 2D CFD inflates numbers due to the assumption of an infinite wingspan, however it paints a good picture of the downforce increase when comparing element setups.
For now, we will go forth will dual-element front and rear wings as I believe it strikes a good balance between performance, cost, and manufacturing time based on my past experience as the Composites Manufacturing Lead. More elements can be added to the design as deemed necessary.
Until next time.